This is Follow up video of the previous Blog,
In this How to use Trace features in STM32 MCU via SWV are explained using STLINKv2 Programmer and Debugger in STM32CubeIDE.
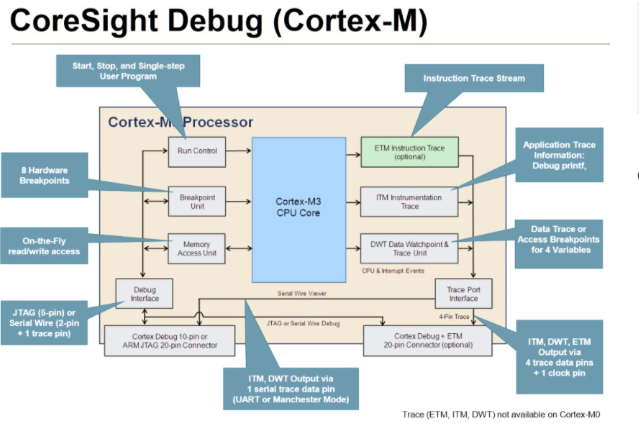
SWV in STM32CubeIDE provide us with following Trace Features to be used in STM32MCU.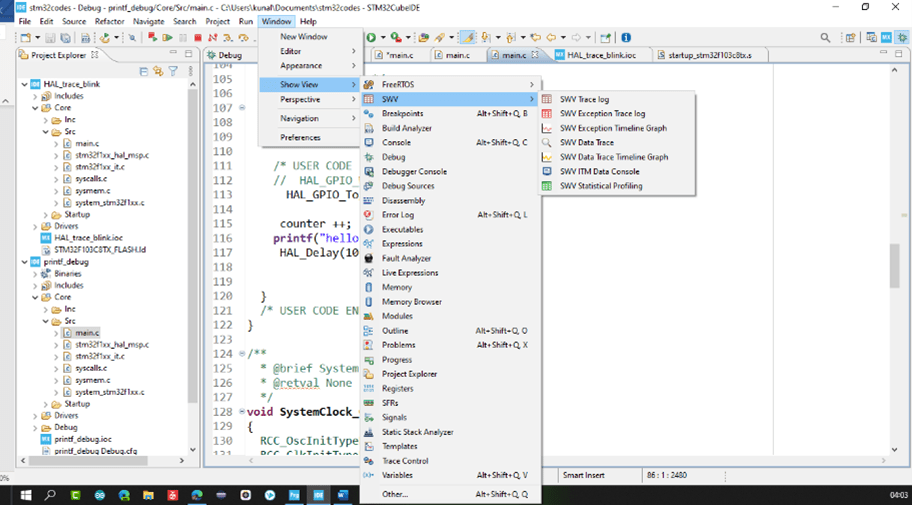
Figure 14
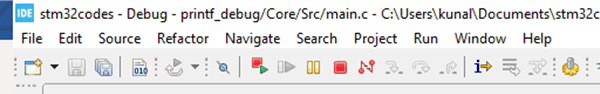
SWV Features can only be used in Debug mode, so after creating your project as mentioned in below section, click on Debug Icon on the Menu bar of CubeIDE.![]()
Figure 15
If you are debugging your code for first time, debug configuration window will pop up, in which u must select your Debugger and made some Configurations.
Main things to select in Debug Configuration window are.
- Debug Probe -> Select GDB server or OpenOCD.
- Enable the Serial wire Viewer(SWV) by checking on enable button and select the Core clock of SWV exactly as the Clock frequency that u have configured for your MCU system Clock, SWO clock as 2000 khz
- Under Misc. Section select the Enable Live Expressions
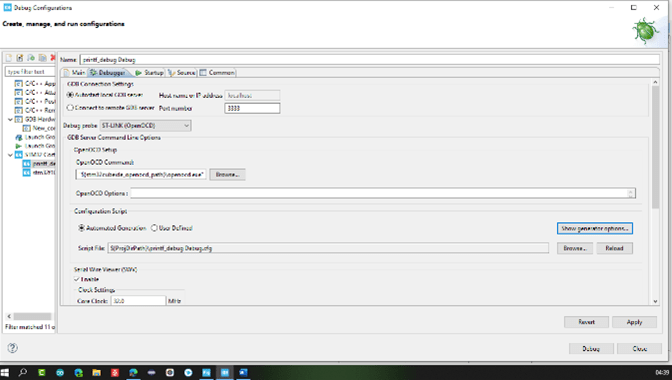
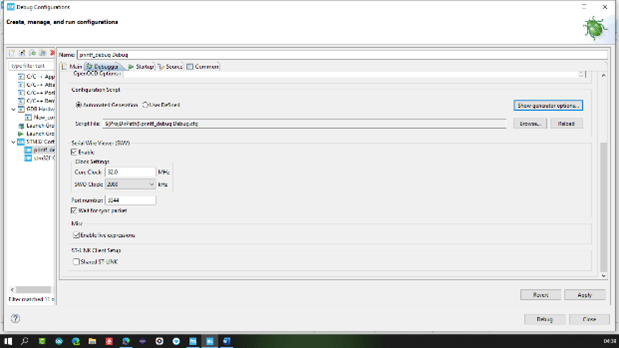 Figure 16
Out of all SWV features I will be showing how to use marked SWV Trace Features from above pic of SWV Show View.
So first Starting the SWV ITM Data Console which is used for printing printf() commands for printing Strings on the ITM terminal screen without using UART.
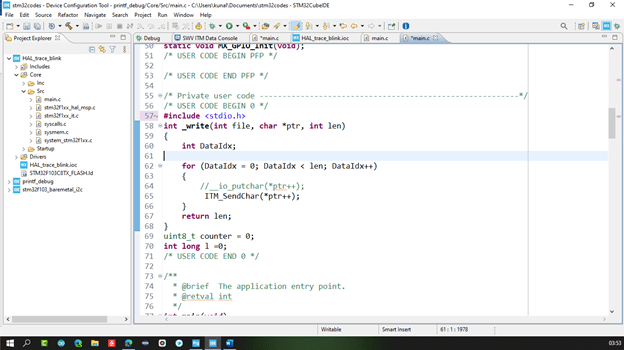
For that We have to include the following code in your main.c file and include Header file Stdio.h in your main.c for printing the printf() commands on your ITM console.
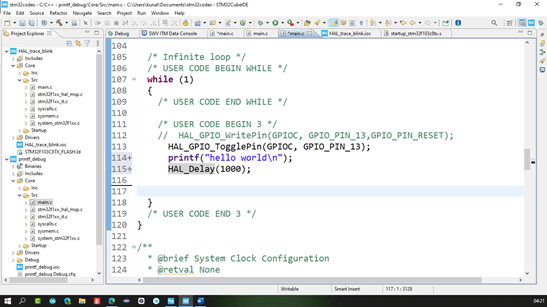
And now in your while loop of main.c file just write printf() commands like these. In the following Pic I have also blinked the led at PC13 pin. And then Debug the code by clicking on Debug Icon in Menu bar of CubeIDE.
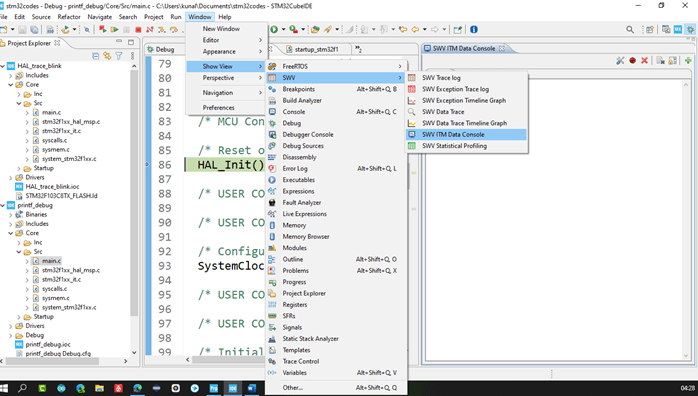
And after entering Debug Mode, click on Window -> Show View -> SWV -> SWV ITM Data console.
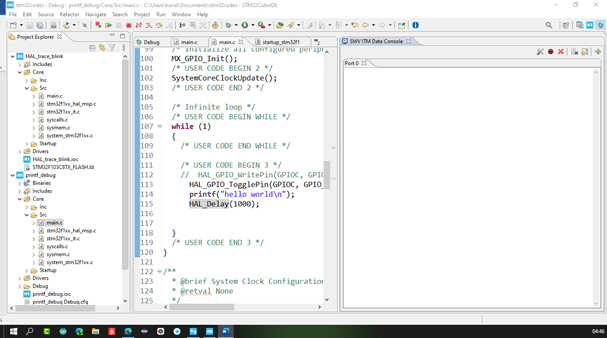
Now as You open the SWV ITM Data Console, or any SWV window, u will find Following 2 icons in every view. 
The first one is the SWV configuration Button, which is very important and configures our SWV. And another one is Start button for Starting the Trace.
At first, we must do the SWV configurations, so click on first button.
SWV Configuration window will pop out. Now For Using the ITM Data console, just click on the below marked check box for printing Printf() commands on the ITM port 0.and then click on ok. 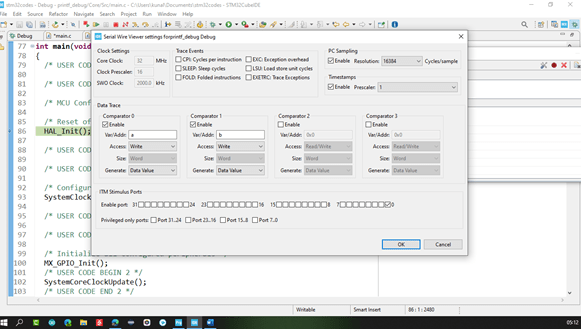
Now start the trace by clicking on Red Button alongside the Configuration button.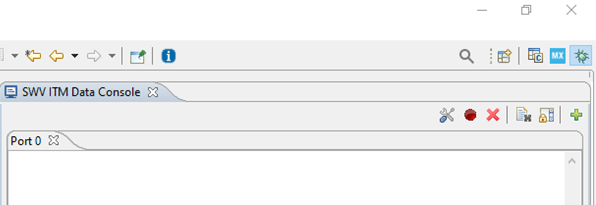
And now Resume the Code in Debug Mode only by clicking on the Resume button in menu bar of Cube IDE.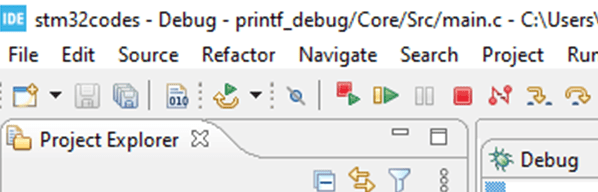
Now as You click on Resume Button, U can see your printf() output strings on the ITM Data console.
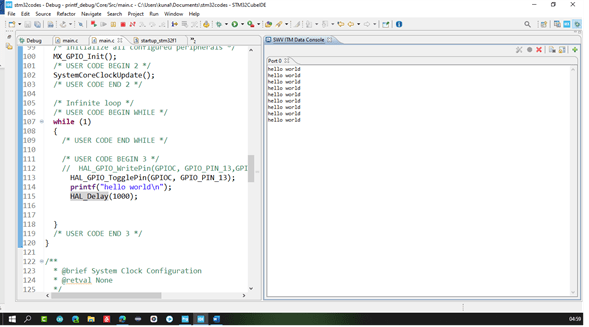
So that is how one can Print the strings using SWV + SWD in STM32 MCU via STLINKv2 without using UART for debugging the firmware.
Click on Suspend button to stop the SWV.
These two windows can be used to trace up to any Variables/Address locations of our code.
Showing their value and other necessary details.
For showing their use case, in our main.c I will be creating two variables by a&b. As shown in below pic.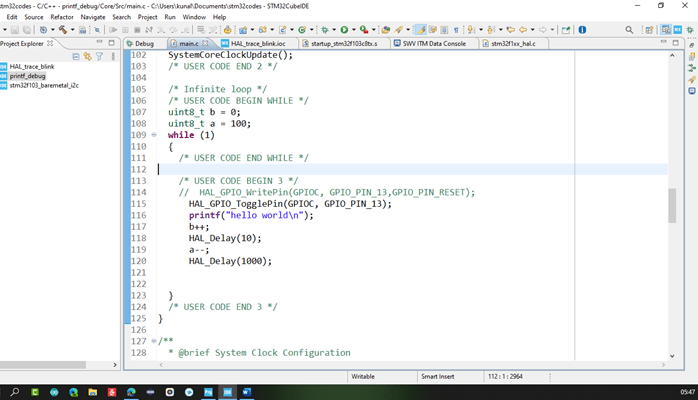
Now debug the code and open the SWV Data Trace and SWV Data Trace Timeline Graph windows. From those windows open the SWV configuration window as told in previous Section.
And do the following changes,
- Enable the Comparator 0 and 1: one can data trace only up to 4 variables or address locations as you can see there are 4 Data Trace Comparators in our SWV Configuration window.
- In Var/Addr sections of Comparator 0&1 write the variables or address locations to be traced.
- And select ACCESS and GENERATE according to your variable being traced or address location being Traced.
- Below is the pic, showing my configurations:
Click on okay and then start the Trace and Resume the Code in Debug Mode only as specified in Previous Section.
Now you will see in SWV Data Trace view, all trace data of configured variables/address locations is being shown under History Section, showing various parameters like Value, Access, Program Counter value, Clock Cycles and Time for the Traced Event. As shown in Figure.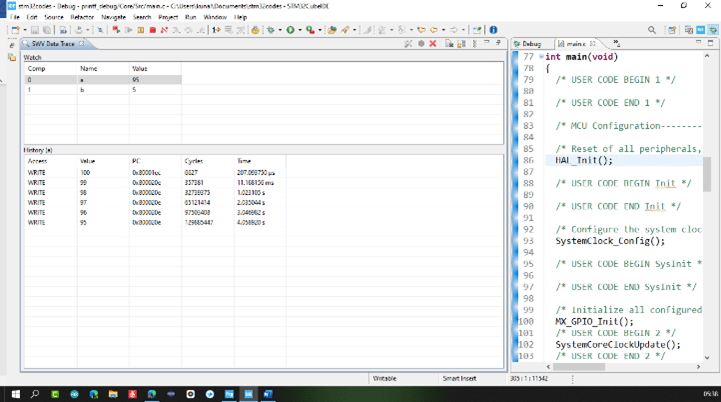
Out of Configured Comparator, one can select for which comparator we want to see the history from the Watch section of Data trace, as shown in above Two pics.
Data trace data can be of great value for monitoring Time critical variables and address locations and observing their behavior during Program execution.
In SWV Data Trace Timeline Graph, one can see the plotting of value of the configured Comparators in the form of graph and Analyzing Variables that are dependent on each other or Time critical. The Graph is plotted as shown in Pic.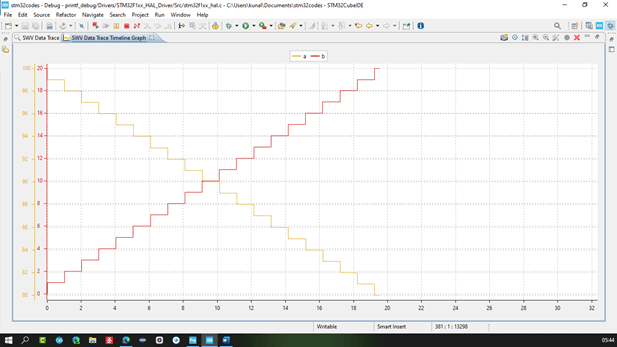
There are various options available on TimeLine Graph window, you can experiment those features by your won.
Is used to see in which functions of your code, CPU is spending too much of time when program is running in MCU.
To use SWV Statistical Profiling we do not have to write any code, just do as mentioned in Various Trace Features by SWV and Using them section above and enable the PC Sampling in SWV configuration window.
Then start the trace and Resume the Code in Debug code as told in above sections. Now For Statistical Profiling wait for x number of secs after resuming your code according to your choice, in that time no data will be shown on Screen. After x amount, suspend the Program Execution and You will see something like this.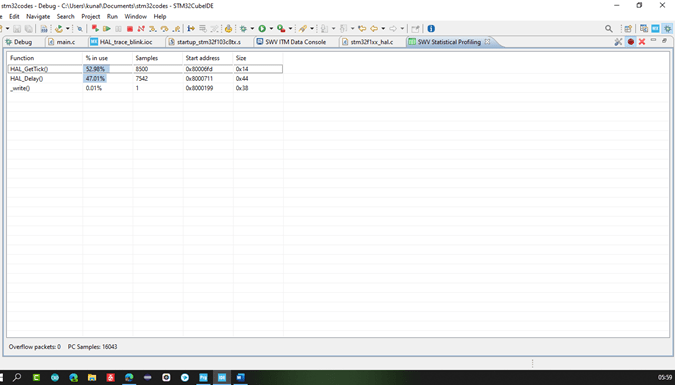
As you can see, in above pic one can analyse in which functions our code is spending most of the and how much time. Which can be of great help in Very Complex codes which includes multiple I/O files and Operations.
Hope U like the Blog and get some Learning and insights on how to use SWV and Trace features in STM32 MCU by Cube IDE via STLINKv2.
Playlist for Debugging techniques in Firmware development: https://www.youtube.com/playlist?list=PLb_Q-Ps0nJou2Ped93q02JRfiMCJorLYX