Table of Contents
Other Processors to know about
Overview
In my Last Blog We talk about Trace and Debug Features in Firmware development. What role does they play and their importance in Developing Firmware for any project and Product can be of Great Importance.
Now If you are an enthusiastic engineer just like me. You might be interested in how Debug and Trace things are working and implemented in our Embedded Controllers.
Like Our CPU processors are running at higher frequency of more than 10 MHz (Just to tell Some even run at more then 100-200 MHz). That is, they can perform 1000000 instructions in just a single second!!!! That is fast and insane.
As I have mentioned in Previous Blog about the Debugging Features, one can execute the instructions line by line. By that I mean that one can execute 1 instruction at a time. Just imagine how fast it executes 1 instruction and one can control those executions which are happening in ns,ms,us. Doesn’t this excite you; how does that happen????????
Or if We talk about Setting Breakpoint and then halting the processor, like it means when the CPU is executing 10000000 instructions per second. One can stop Our Machine that is running at the speed of MHZ at any Particular Instruction!!!!
If talking About Trace Features, it tells about our code Performance and efficiency.
So, generating data like How much time does the instructions take, time for their execution, space used by them and the effect of them in our Code and Performance. Does it not excite and make you think that how actually all these things are happening inside our MCU Core Processor. And remember guys all such things are happening at a time delay of ms, ns, us. That is fast and insane.
So, telling You Answer for these Questions, As I have mentioned in My previous Blog also that Trace and Debug is just like a Peripheral in our Core Processors. And they have their Own Circuitry, Components, Communication Protocol, Communication Pins, Communication Busses and Own Programmable Registers for configuring Which Debug and tracer features to use and setting them up.
In the case of ARM Processors This Peripheral is designed by the name of CoreSight Architecture. Now it has a number of components like ITM, DWT, STM, DAP etc. which collectively provides features of debug, Trace, Timestamp, Prolific Counters and many more.
CoreSight Debug Architecture

“The ARM Cortex M/R/A processor uses the CoreSight for on-chip Debug and Trace capabilities.”
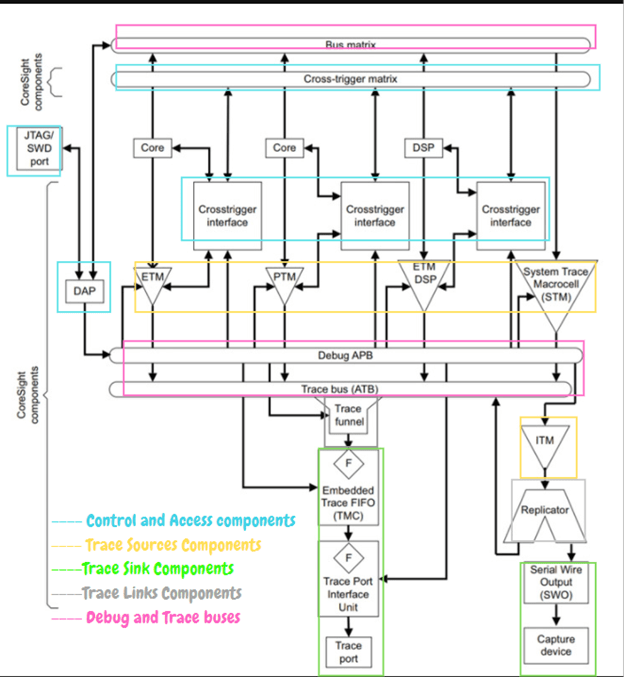
CoreSight Architecture is designed in a very modular way which has Number of Components and Units providing debug and trace solutions with high bandwidth for whole systems, including trace and monitor of the system bus. These Components can be categorized in following Sections:
- Control and Access Components à Configure, access, and control the generation of trace/Debug. They do not generate traces, nor process the trace data.
- Debug Access Port (DAP)
- Embedded Cross Trigger (ECT)
- Trace Sources-> Components which generate trace data.
- Embedded Trace Macrocell (ETM)
- Instrumentation Trace Macrocell (ITM)
- AHB Trace Macrocell (HTM)
- Flash Patch and Breakpoint unit (FPB)
- Data Watchpoint and Trace Unit (DWT)
- Program Trace Macrocell (PTM)
- System Trace Macrocell (STM)
- Embedded Logic Analyzer (ELA)
- Trace Sink -> Sinks are the endpoints for trace data on the SoC.
- Trace Port Interface Unit (TPIU)
- Trace Memory Controller (TMC)
- Serial Wire Output (SWO)
- Embedded trace Buffer (ETB)
- Trace Links-> provide Connection, triggering and flow of traced data between Source and Sink.
- Trace Funnel
- Trace Replicator
- ATB Bridge
- Debug and Trace Buses à The CoreSight systems use the following bus protocols to connect components together, and to enable integration in a SoC.
- AMBA Trace Bus (ATB).
- AMBA 3 Advanced Peripheral Bus (AMBA 3 APB).
- Advanced High-Performance Bus (AHB).
- AMBA Advanced extensible Interface (AXI)
ARM licenses the different Components of CoreSight Architecture to the SoC manufacture vendors.
According to the ARM Processor these Components vary like in Cortex -A72, Trace Source components ELA and STM are there whereas in Cortex M3/M4, Trace Source Components ELA and STM are not included in its Architecture.
Same way-out Trace Sink Components also vary from ARM Processor to processor.
Depending on these Units and Components used by vendors for their Processor design there can be changes in features available for trace and Debug.
Debug Access Port (DAP)
Enables the Debug Access between SoC and Host Debugger. Debug Ports are used to access External Debugger and Access Ports are used for on chip System Resources.
Debug Port (DP)
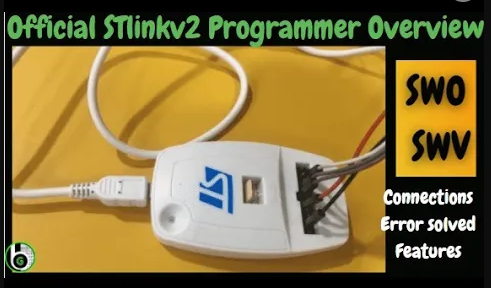
JTAG and SWD (+SWO pin – for trace) are the communication Protocols which can be used for Debug/Trace. Now for Connecting and having communication with MCU core to the host debugger (Stlinkv2), we need special Port (I/O pins) on the MCU as these protocols work at very high bandwidth and are directly in play with the Processor. This port is called Debug Port.
There are 3 Debug port modules which are available in all ARM cortex M processors:
- SWJ-DP (Serial wire JTAG Debug Port) à Supports both Serial Wire and JTAG protocols
- SW-DP (Serial wire Debug Port) à Supports only Serial Wire Protocol.
- JTAG-DP (JTAG Debug Port)à Supports only the JTAG Protocol, available in older generations of ARM Processor and almost every Processor.
Debug and Trace Buses & Access Port (AP)
Access Port is a Port that connects the DP and the Components of the CoreSight Architecture.
The CoreSight systems use the following bus protocols to connect components together, and to enable integration in a SoC.
- AMBA Trace Bus (ATB-AP)
- AMBA 3 Advanced Peripheral Bus (AMBA 3 APB)
- Advanced High-Performance Bus (AHB-AP)
- AMBA Advanced extensible Interface (AXI-AP)
ARM Cortex M3/M4 Advanced High-Performance Bus (AHB-AP) is used for internal debug bus protocol to connect different Debug Components together.
Embedded Cross Trigger
The ECT is a modular component that supports the interaction and synchronization of multiple triggering events within a SoC.
There are Two types of Modules in ECT:
- CTI (Cross Trigger Interface) Provides the Interface between a component and Cross Trigger Matrix (CTM).
- CTM (Cross Trigger Matrix) enables the subsystems to interact, cross Trigger, with one another.


