


Table of Contents Other Processors to know about Overview In my Last Blog We talk about Trace and Debug Features in Firmware development. What role does they play and their importance in Developing Firmware for any project and Product can be of Great Importance. Now If you are an enthusiastic engineer just like me. You might be interested in how Debug and Trace things are working and implemented in our Embedded Controllers. Like Our CPU processors are running at higher frequency of more than 10 MHz (Just to tell Some even run at more then 100-200 MHz). That is, they can perform 1000000 instructions in just a single second!!!! That is fast and insane. As I have mentioned in Previous Blog about the Debugging Features, one can execute the instructions line by line. By that I mean that one can execute 1 instruction at a time. Just imagine how fast it executes 1 instruction and one can control those executions which are happening in ns,ms,us. Doesn’t this excite you; how does that happen???????? Or if We talk about Setting Breakpoint and then halting the processor, like it means when the CPU is executing 10000000 instructions per second. One can stop Our Machine that is running at the speed of MHZ at any Particular Instruction!!!! If talking About Trace Features, it tells about our code Performance and efficiency. So, generating data like How much time does the instructions take, time for their execution, space used by them and the effect of them in our Code and Performance. Does it not excite and make you think that how actually all these things are happening inside our MCU Core Processor. And remember guys all such things are happening at a time delay of ms, ns, us. That is fast and insane. So, telling You Answer for these Questions, As I have mentioned in My previous Blog also that Trace and Debug is just like a Peripheral in our Core Processors. And they have their Own Circuitry, Components, Communication Protocol, Communication Pins, Communication Busses and Own Programmable Registers for configuring Which Debug and tracer features to use and setting them up. In the case of ARM Processors This Peripheral is designed by the name of CoreSight Architecture. Now it has a number of components like ITM, DWT, STM, DAP etc. which collectively provides features of debug, Trace, Timestamp, Prolific Counters and many more. CoreSight Debug Architecture “The ARM Cortex M/R/A processor uses the CoreSight for on-chip Debug and Trace capabilities.” CoreSight Architecture is designed in a very modular way which has Number of Components and Units providing debug and trace solutions with high bandwidth for whole systems, including trace and monitor of the system bus. These Components can be categorized in following Sections: Control and Access Components à Configure, access, and control the generation of trace/Debug. They do not generate traces, nor process the trace data. Debug Access Port (DAP) Embedded Cross Trigger (ECT) Trace Sources-> Components which generate trace data. Embedded Trace Macrocell (ETM) Instrumentation Trace Macrocell (ITM) AHB Trace Macrocell (HTM) Flash Patch and Breakpoint unit (FPB) Data Watchpoint and Trace Unit (DWT) Program Trace Macrocell (PTM) System Trace Macrocell (STM) Embedded Logic Analyzer (ELA) Trace Sink -> Sinks are the endpoints for trace data on the SoC. Trace Port Interface Unit (TPIU) Trace Memory Controller (TMC) Serial Wire Output (SWO) Embedded trace Buffer (ETB) Trace Links-> provide Connection, triggering and flow of traced data between Source and Sink. Trace Funnel Trace Replicator ATB Bridge Debug and Trace Buses à The CoreSight systems use the following bus protocols to connect components together, and to enable integration in a SoC. AMBA Trace Bus (ATB). AMBA 3 Advanced Peripheral Bus (AMBA 3 APB). Advanced High-Performance Bus (AHB). AMBA Advanced extensible Interface (AXI) ARM licenses the different Components of CoreSight Architecture to the SoC manufacture vendors.According to the ARM Processor these Components vary like in Cortex -A72, Trace Source components ELA and STM are there whereas in Cortex M3/M4, Trace Source Components ELA and STM are not included in its Architecture.Same way-out Trace Sink Components also vary from ARM Processor to processor.Depending on these Units and Components used by vendors for their Processor design there can be changes in features available for trace and Debug. Debug Access Port (DAP) Enables the Debug Access between SoC and Host Debugger. Debug Ports are used to access External Debugger and Access Ports are used for on chip System Resources. Debug Port (DP) JTAG and SWD (+SWO pin – for trace) are the communication Protocols which can be used for Debug/Trace. Now for Connecting and having communication with MCU core to the host debugger (Stlinkv2), we need special Port (I/O pins) on the MCU as these protocols work at very high bandwidth and are directly in play with the Processor. This port is called Debug Port. There are 3 Debug port modules which are available in all ARM cortex M processors: SWJ-DP (Serial wire JTAG Debug Port) à Supports both Serial Wire and JTAG protocols SW-DP (Serial wire Debug Port) à Supports only Serial Wire Protocol. JTAG-DP (JTAG Debug Port)à Supports only the JTAG Protocol, available in older generations of ARM Processor and almost every Processor. Debug and Trace Buses & Access Port (AP) Access Port is a Port that connects the DP and the Components of the CoreSight Architecture. The CoreSight systems use the following bus protocols to connect components together, and to enable integration in a SoC. AMBA Trace Bus (ATB-AP) AMBA 3 Advanced Peripheral Bus (AMBA 3 APB) Advanced High-Performance Bus (AHB-AP) AMBA Advanced extensible Interface (AXI-AP) ARM Cortex M3/M4 Advanced High-Performance Bus (AHB-AP) is used for internal debug bus protocol to connect different Debug Components together. Embedded Cross Trigger The ECT is a modular component that supports the interaction and synchronization of multiple triggering events within a SoC. There are

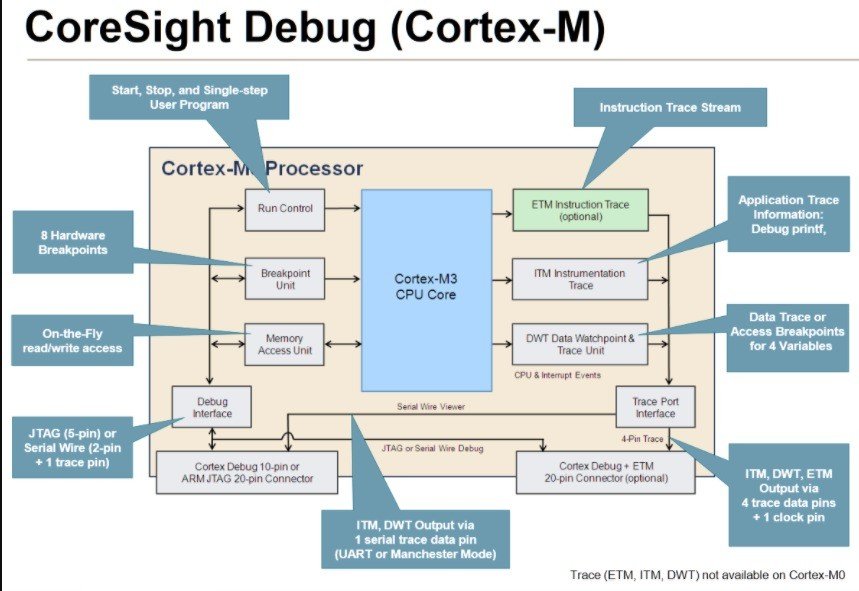
Table of Contents Definition of ARM CoreSight \”CoreSight is the Debug Architecture from ARM for Debugging and Trace Solutions in Complex SoC designs (Single core and Multi core)\” CoreSight Provides all the Infrastructure that is required to Debug, Trace, Monitor, and optimize the performance of a Complete System on Chip (SoC)Design. The Debug and Trace Features of the ARM Cortex M processors (M3/M4/M33/M7/M0, etc.) are designed based on the CoreSight Debug Architecture. This Architecture Covers a Wide Area Including Debug Interface protocols, on chip bus for debug access, Control of debug components, security features, trace data interface and more. Debug and Trace in Embedded Systems By now one obvious question to beginners or newbies that must have come in their mind is what is Debug and Trace. What are these features for which we have a whole complete Architecture called CoreSight? Why do we need Debug and Trace solutions in our Processors/Embedded Controllers? Is it not? For those readers They can check out this blog, providing you clarity and understanding of all such questions. One can Understand Debug and Trace Feature/Functionality as one of the Block/Unit of the Processor. Just like We have UART, SPI, I2C, etc. peripherals for our Microcontrollers for which we have separate Block, Architecture, Peripheral Memory Registers for accessing them and Communication Protocol pins in our Microcontroller. Same Way-out Debug/Trace is one of the peripherals which is present in our Processor for which it has its whole architecture and above Marked things. ARM Processor has CoreSight Architecture. MIPS Processor has EJTAG Architecture. IBM PowerPC processor has COP. (Units/Block of the Processor are not called peripherals, I have used the above term just to make u understand the analogy) What are Debug Features?? Features are used to observe or modify the state of parts of the design. This is also Called Invasive Debugging Execute instructions line by line function i.e., halting the processor after execution of each line of code(single stepping). Execute Instructions Function by function i.e., halting the processor after execution of each functions (Step Over) Return from the Function (Step Return/Step Out) Stop the processor (halting) Stop the Processor at a particular à line of code (called Breakpoint) àmemory address (Called Watchpoint) à coded condition of a variable or memory address is achieved (Conditional Breakpoint/Watchpoint) On can control the program execution (By points 1-5)so as to examine(Both read or Write) the change in value of bits of the MCU Peripheral registers and Core Processor Registers (like examining the contents of UART peripheral Registers to mark at which line of code data is received or transmitted by seeing the UART Status registers which has corresponding bits to indicate the event of receiving and transmit data). Debug frequently involves halting execution once a failure has been observed and collecting state information retrospectively to investigate the problem. There are 2 Communication Protocols For using Debug Features: SWD & JTAG JTAG is an industry Standard protocol (IEEE 1149.1) which is used for debugging and boundary scan testing. It is the de facto Serial Protocol which is present in almost every Processor Family other than ARM also like AVR 8 core, MIPS, PowerPC, etc. To be noted down: JTAG Requires 4 pins: TCK, TDI, TMS, TDO; the recent signal TRST is optional. ARM CoreSight Technology introduced the 2 wire Protocol SWD (Serial Wire Debug): SWCK and SWDIO which is used for Debugging all the ARM based Processors. The Serial Wire debug(SWD) protocol provides the same debug access features and supports parity error detection, which enables better reliability in systems with higher electrical noise. Therefore, the Serial Wire debug protocol is more favorable then JTAG Interface. Also, SWD and JTAG debug protocols share the same Connections: TCK and SWCL use the same pin, TMS and STDIO use the same pin. The SWD port alone does not allow real-time tracing. What are Trace Features?? Trace refers to the process of capturing data that shows information about how the components in a design of a firmware are operating, executing, and performing. This is also Called Non-invasive Debugging. It is real-time (with a small timing delay) and can provide a lot of useful information without stopping the processor. Information like: Amount of execution time for each function(Statistical Profiling) Call hierarchy and execution time sequence of functions Event Execution timing(Timestamp) Clock cycles taken for execution of a particular Instruction. Examine or change the contents of the memory or peripherals at any time, even when the processor is running. This feature is often called on-the-fly memory access. Data Trace(Monitoring the Variable or Memory address in Real Time execution of Code and Plotting their graph). Instruction Trace(information about Instruction execution of a Core)ETM & PTM). Instrumentation Trace (Printf () Statement via ITM). System trace Trace is an advanced version of Debugging as it analyzes the performance of our firmware code and how efficient it is in terms of memory and efficiency by capturing the various kinds of data when the CPU is running. For Trace features there are 2 Modes: 1 Serial-Pin model called Serial Wire Viewer à Using Serial Wire Output (SWO) with Serial Wire Debug (SWD) interface. The Serial Wire Output (SWO) pin can be used in combination with SWD. It is used by the processor to emit real-time trace data, thus extending the two SWD pins with a third pin. The combination of the two SWD pins and SWO pin enables Serial Wire Viewer (SWV) real-time tracing in compatible Arm® processors. The Serial Wire Viewer (SWV) is a real-time trace technology that uses the Serial Wire Debug (SWD) port and the Serial Wire Output (SWO) pin. The Serial Wire Viewer provides advanced system analysis and real-time tracing without the need to halt the processor to extract the debug information. 2 Multi-pin Trace Port interface (4 data pins + 1 clock pin). For Capturing the Data There must be à Source for generating the Trace data àSinks are the endpoints of trace data à Links provide Connection, triggering and flow of traced data between