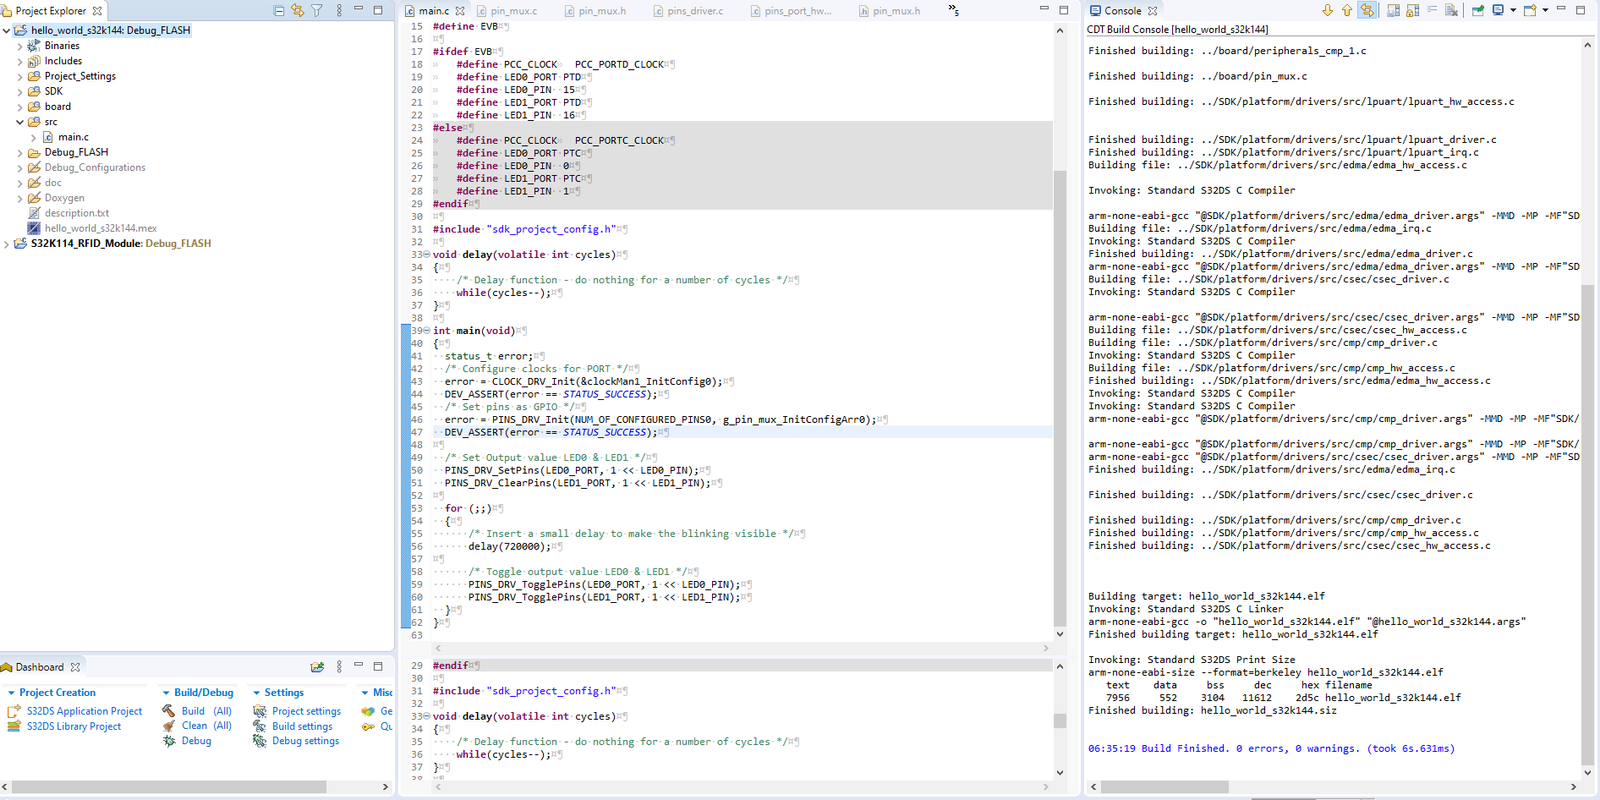
Now after code configuration, our code will be generated. We can see the project files/folder in Project Explorer and write/modify/develop the c/cpp code on the code editor. As shown below. Now it’s time to explore the features S32 Design Studio provides for code navigation and development.

Now in this section, I am going to talk about different features/views present in S32 Design Studio for Embedded Code navigation/development.
Text Editor view: This is the main view, onto which programming is done. Double clicking on any file from Project Explorer will open the open in text editor.
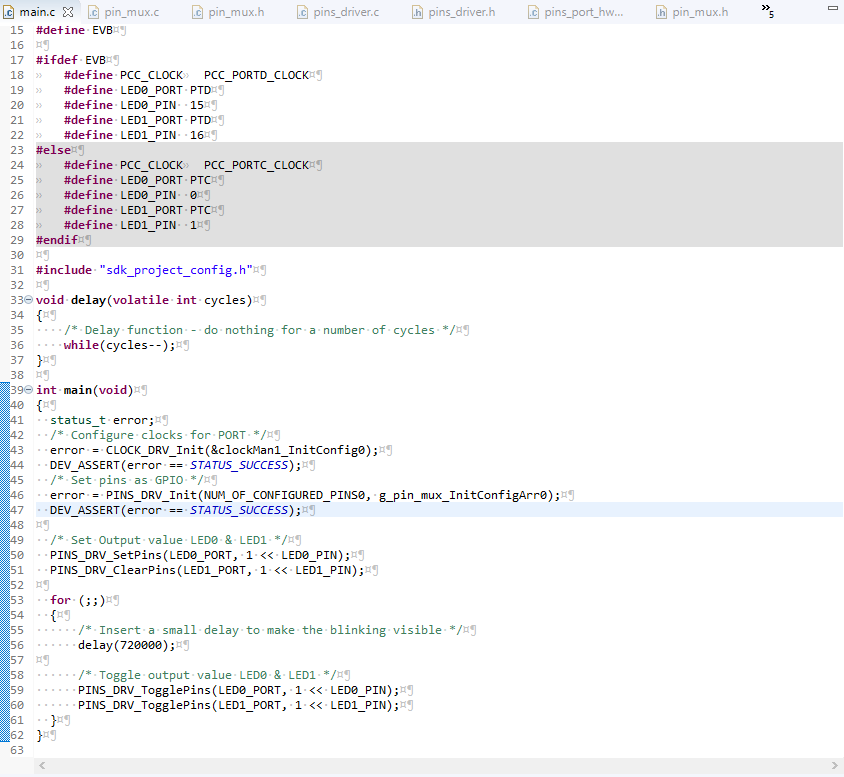 We can configure the Text Editor by going to Window->Preferences. We can configure Text editor features like Line number, White space characters, Text Editor Colors. It’s good to explore such features to make the development process on S32 DS interesting.
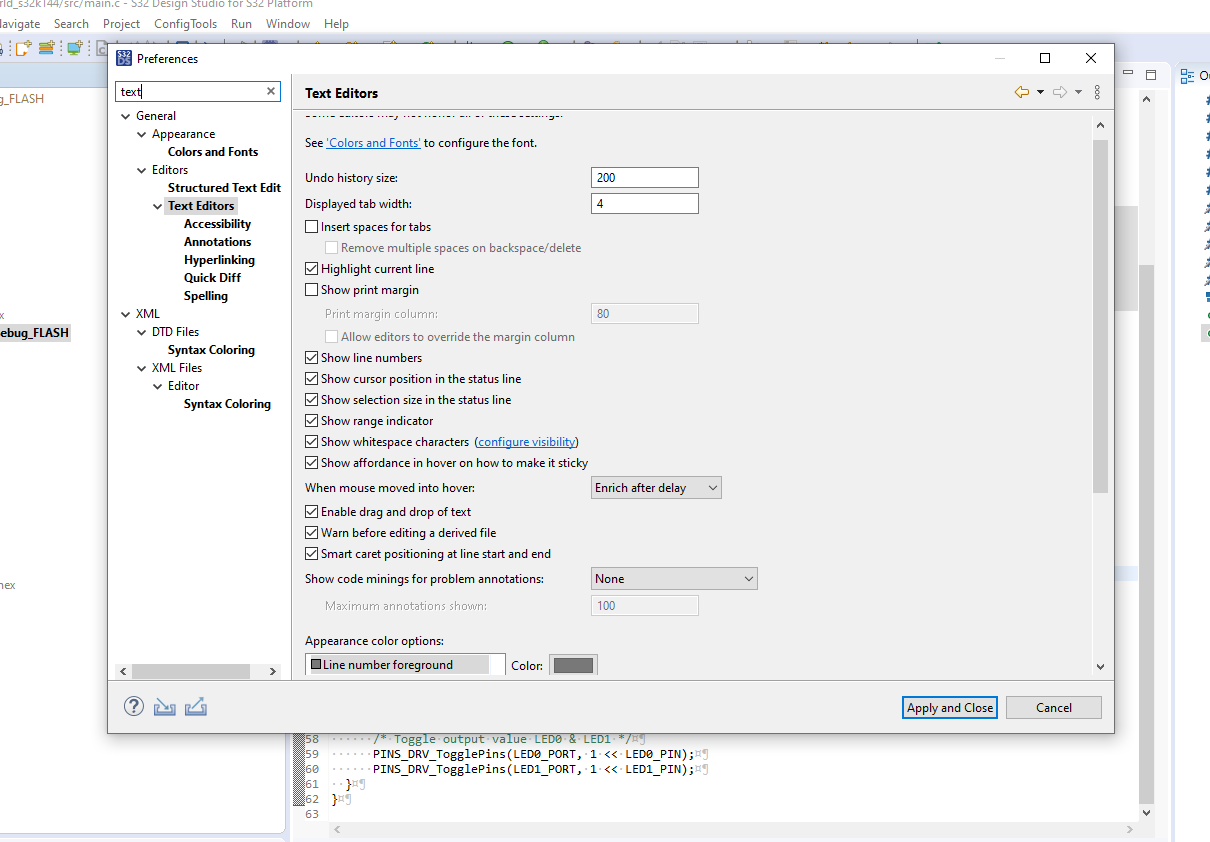
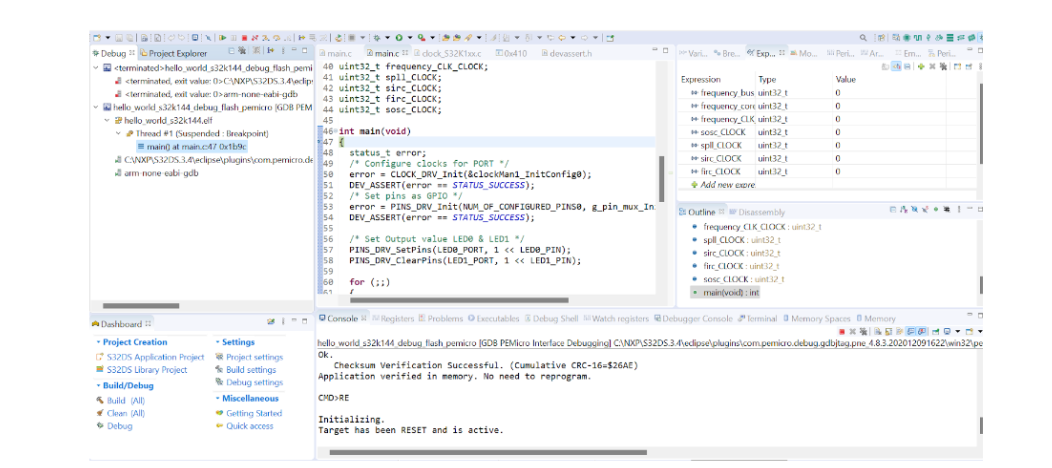
Outline view: This is one of the best and most useful view. The  Outline view displays an outline of a structured C/C++ file that is currently open in the editor area, by listing the structural elements.
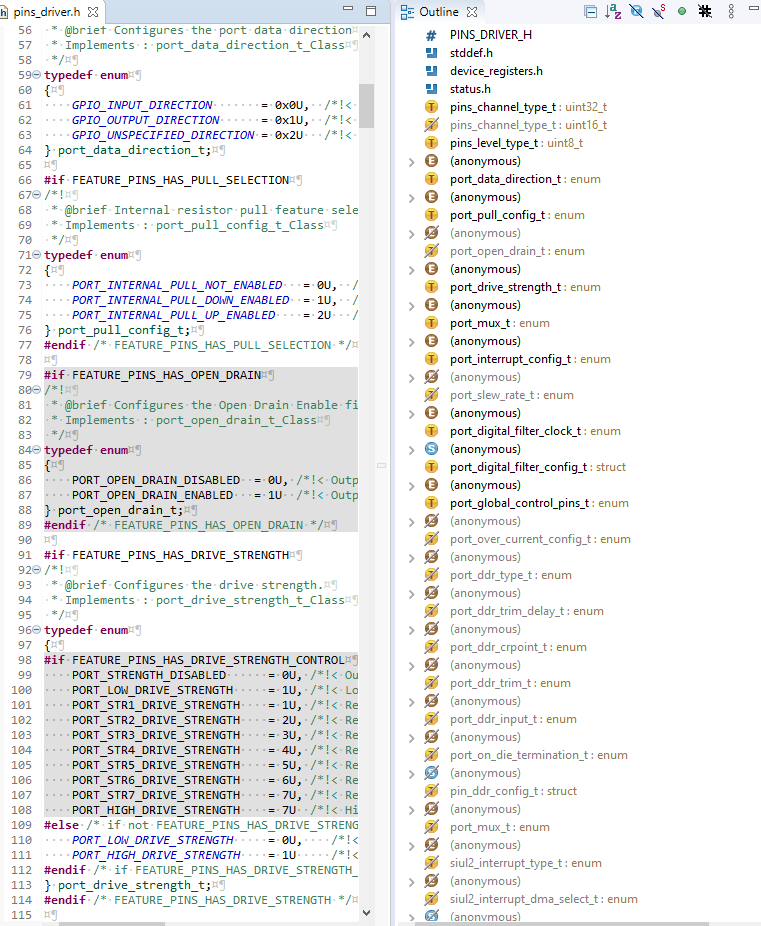 As you can see, this view makes very easy for navigation in the corresponding .c/.h file.
Console: Console is the place where we can see the Verbos of the compilation process of our project. During compilation process. all the errors and warnings are listed in console window. 
Project Explorer: Project Explorer view is the one where we can see our project, when it is created or opened. One can see the proper folder structure and files which are their in our project.
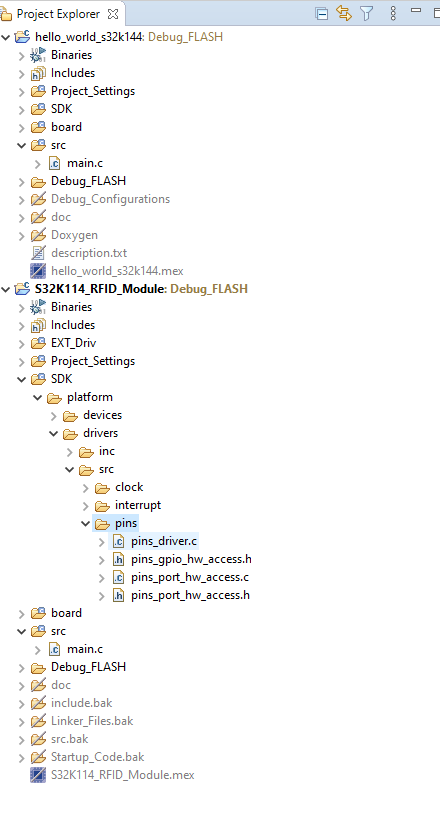
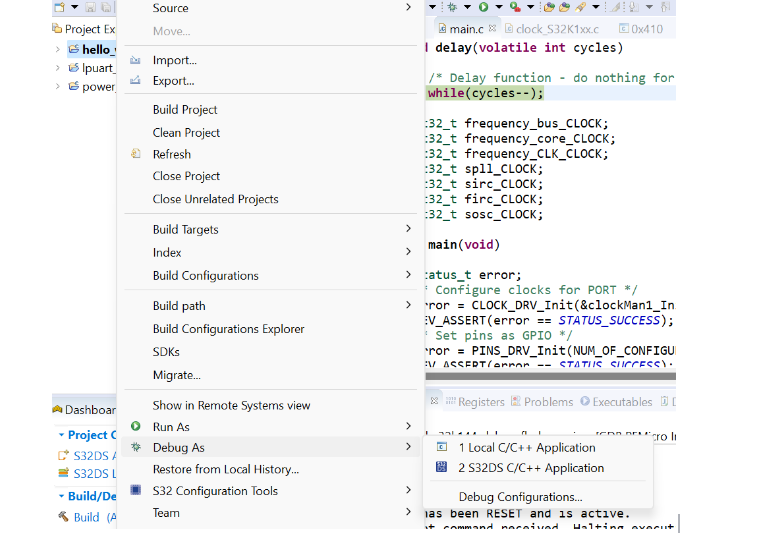
By left clicking, on the project in Project Explorer, we can configure our project.
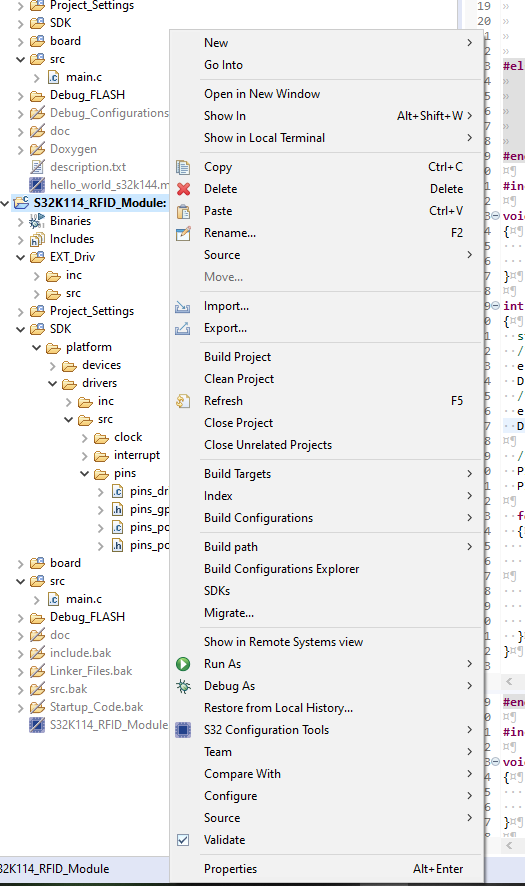
We can configure the project in terms of New File/Folder Creations in our project, Build Configurations and SDK management of our project.
One of the most important options in this list is Properties, where we can configure Project setting of our project. I leave this section to explore on own, if you face any issue or want to know things mention them in below comment section.
Search: Often during the course of Embedded Software development, we would be dealing with the large Project’s in which there are 1000’s of lines of code written in single file and 100’s of files are there. So, in that case using the search view makes things easy to locate.