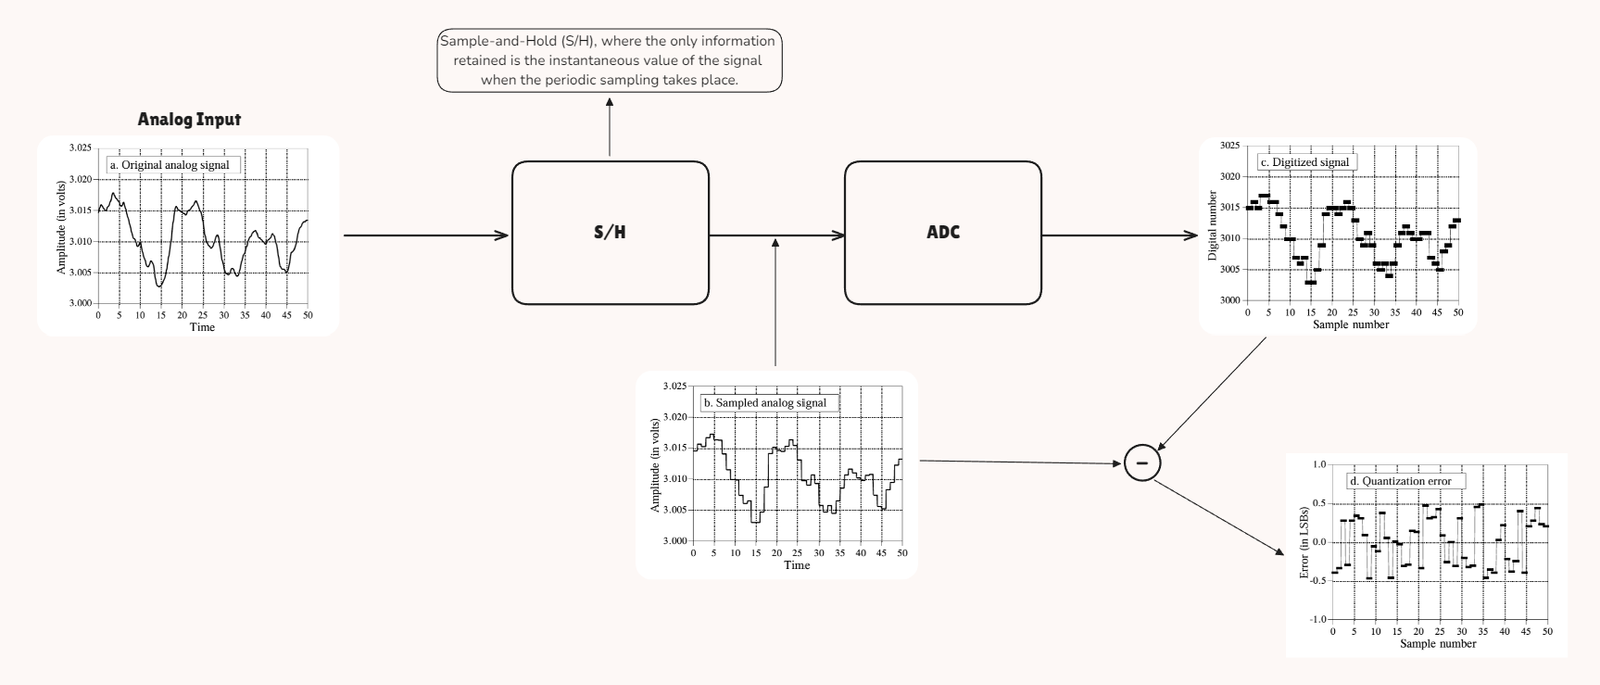
ADCs were introduced to enable digital systems to interact with and process the analog signals prevalent in the real world, thereby expanding the functionality and applications of digital technology.
Necessity of ADC
- Analog Signals in the Real World: Many physical signals, like temperature, light, and sound, are analog. This means they vary continuously and can take any value within a range. Digital systems, on the other hand, operate using discrete values (binary).
- Digital Processing: Modern electronic systems, including microcontrollers, computers, and digital signal processors, work with digital data. To process analog signals (like from sensors or input devices), they need to be converted into a digital form.
- Data Accuracy and Consistency: ADCs provide a way to digitize analog signals accurately and consistently, allowing digital systems to process and interpret the data effectively.

Basics of Analog-to-Digital Conversion
- Sampling:
- What It Is: The process of taking discrete samples of the continuous analog signal at regular intervals.
- Purpose: Converts the continuous signal into a series of discrete values.
- Example: Measuring the voltage of a sensor at fixed intervals (e.g., every millisecond).
2. Quantization:
- What It Is: Assigning each sampled value to the nearest value within a finite set of levels.
- Purpose: Converts the discrete samples into digital values.
- Example: An analog voltage of 2.7V might be rounded to the closest digital value, like 3V, depending on the resolution of the ADC.
3. Resolution:
- What It Is: The number of discrete values that the ADC can output. It’s often represented in bits.
- Purpose: Determines the precision of the digital representation.
- Example: A 10-bit ADC can represent 1,024 discrete levels, while a 12-bit ADC can represent 4,096 levels.
4. Quantization Error:
- Definition: The difference between the actual analog signal value and the value represented by the ADC after quantization.
- How It Occurs: When an analog signal is converted to a digital value, it is mapped to the nearest discrete level available in the ADC’s resolution. This process involves rounding the continuous range of the analog signal to the closest value that can be represented by the ADC.
- Impact: Introduces inaccuracy because the continuous range of analog values is approximated to a finite set of discrete levels.
- Example: If an analog signal has a voltage of 2.7V, but the closest digital value in a 10-bit ADC is 2.6V or 2.8V, the quantization error is the difference between the actual voltage and the nearest digital value.
- Error Range: The maximum quantization error is typically half the value of one least significant bit (LSB) of the ADC. For a 10-bit ADC with a reference voltage of 5V, the LSB is 5V/1024 ≈ 4.88mV. The maximum quantization error would be approximately ±2.44mV (half of the LSB).
- Mitigating Quantization Error:
- Higher Resolution ADCs: Using ADCs with higher resolution reduces quantization error because they have more discrete levels to represent the analog signal more accurately.
- Oversampling and Averaging: Sampling the signal at a higher rate and averaging the results can help reduce the impact of quantization error.
4. Sampling Rate:
- What It Is: The rate at which samples are taken from the analog signal.
- Purpose: Affects how accurately the ADC can capture the signal’s behavior over time.
- Example: A higher sampling rate can capture fast changes in the signal more accurately.
The standard model of quantization error assumes that the error behaves like random noise. However, this model doesn’t always apply. One notable exception occurs when the analog signal remains nearly constant over many samples. In such cases, the ADC output can become “stuck” at the same digital value, even though the analog signal may be varying slightly within ±½ LSB. This results in a thresholding effect or distortion rather than random noise.
To address this issue, dithering is commonly used. Dithering involves adding a small amount of random noise to the analog signal before digitization. This noise is typically normally distributed and has a standard deviation of about 2/3 LSB. The effect of dithering is illustrated in the following example:
Without Dithering: If you have an analog signal of 3.0001V, which is between digital levels 3000 and 3001, and you take 10,000 samples, all samples will read as 3000, due to the signal being too close to the digital threshold to affect the ADC output.
With Dithering: When dithering noise is added, the samples will oscillate between 3000 and 3001. About 90% of the samples will read 3000, and 10% will read 3001. Averaging these samples yields a value close to 3000.1V, providing a more accurate representation of the analog signal.
Interestingly, adding a controlled amount of noise can improve measurement accuracy by preventing the ADC output from getting stuck at a single level. This demonstrates how random noise, when managed properly, can actually enhance the precision of digital measurements.
Sampling and The Sampling Theorem
- Sampling is the process of converting a continuous analog signal into a discrete digital form by taking measurements at regular intervals. This conversion allows analog signals to be processed and analyzed by digital systems. For instance, in digital audio, an analog audio signal is sampled at a high frequency, such as 44.1 kHz, to capture its amplitude at discrete time points.
- The Sampling Theorem, also known as the Nyquist-Shannon Sampling Theorem, is a fundamental principle in digital signal processing. It states that a continuous signal can be accurately represented and perfectly reconstructed from its samples if it is sampled at a rate that is at least twice the highest frequency component present in the signal. This minimum sampling rate is known as the Nyquist Rate.
Mathematically, the theorem is expressed as:

where fs is the sampling rate and fmax is the highest frequency in the signal.
Importance of Sampling Theorem:
- Prevents Aliasing: Sampling below the Nyquist Rate can lead to aliasing, where higher frequency components are incorrectly represented as lower frequencies, causing distortion.
- Ensures Accurate Reconstruction: Sampling at or above the Nyquist Rate ensures that the original analog signal can be perfectly reconstructed from its digital samples.

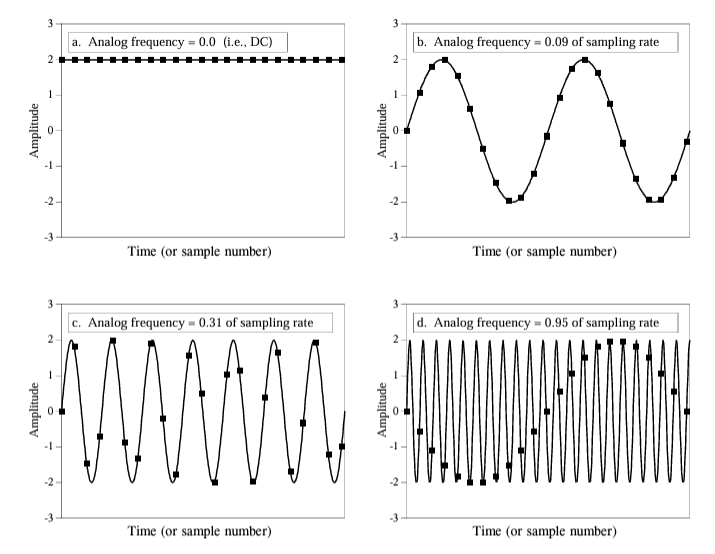
Above are the examples of different sampling rates where (a) and (b) are examples of proper sampling whereas (c) and (d) are examples of improper sampling. Specifically talking about (d) it a great example to understand aliasing.
Proper and Improper Sampling
Proper Sampling: Proper sampling refers to sampling a signal at a rate that meets or exceeds the Nyquist Rate. This ensures that the signal is captured accurately without distortion. Proper sampling allows for the faithful reconstruction of the original analog signal from its discrete samples.
Characteristics of Proper Sampling:
- Sufficient Rate: Sampling rate is at least twice the highest frequency component of the signal.
- Accurate Representation: The digital representation closely matches the analog signal, preserving all important details.
Example: Sampling an audio signal with a maximum frequency of 20 kHz at a rate of 44.1 kHz is proper sampling. This allows for accurate digital representation and playback of the audio.
Improper Sampling: Improper sampling occurs when the sampling rate is lower than the Nyquist Rate, leading to aliasing. In such cases, higher frequency components of the signal are misrepresented as lower frequencies, resulting in distortion and loss of information.
Characteristics of Improper Sampling:
- Insufficient Rate: Sampling rate is less than twice the highest frequency component of the signal.
- Aliasing: High-frequency components are inaccurately represented, causing distortion in the digital signal.
Nyquist Frequency and Nyquist Rate
Nyquist Rate:
- The Nyquist Rate is defined as twice the highest frequency present in the analog signal. This is the minimum sampling rate required to accurately capture the signal without aliasing.
- Example: If an analog signal has a maximum frequency of 3 kHz, the Nyquist Rate is 6 kHz.
Nyquist Frequency:
- The Nyquist Frequency is half of the sampling rate. This is the highest frequency that can be accurately represented in the sampled signal without aliasing.
- Example: For a sampling rate of 8 kHz, the Nyquist Frequency is 4 kHz.
Terminology Confusion:
- The terms Nyquist Rate and Nyquist Frequency are sometimes used interchangeably or differently in various contexts. In general, both refer to the concept of half the sampling rate. To avoid confusion, always check how these terms are defined in the specific context you’re dealing with.
Aliasing
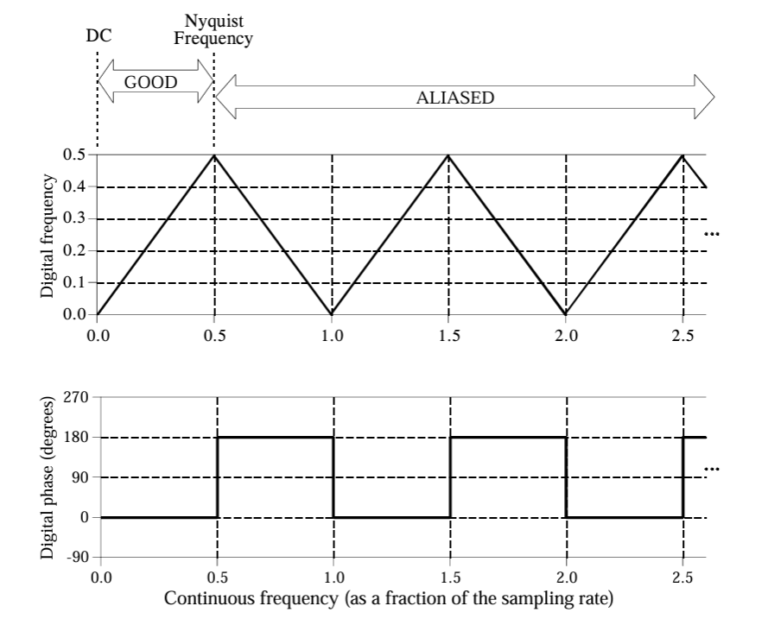
Aliasing happens when a signal is sampled below twice its highest frequency (the Nyquist Rate), leading to distortion. Frequencies above the Nyquist Frequency are misrepresented as lower frequencies, causing overlap and distortion.
- Key Points:
- Frequency Mapping: Higher frequencies fold into lower frequencies, distorting the original signal.
- Information Loss: Aliasing results in the loss of information about both high and low-frequency components.
2. Example:
- Sampling a 3 kHz signal at 5 kHz (Nyquist Frequency is 2.5 kHz) causes frequencies above 2.5 kHz to be misrepresented. A 4 kHz component might appear as a lower frequency in the digital data.
3. Phase Shifts(Important):
- Aliasing can also introduce a 180° phase shift, making the digital signal appear inverted compared to the original.

Impulse Train for Sampling Analysis
Concept:
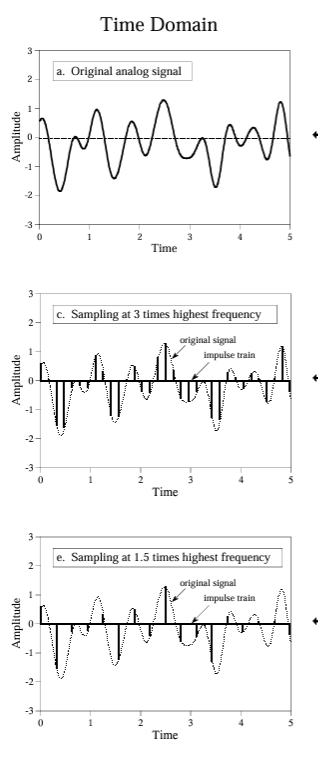
- Impulse Train: A theoretical tool representing the sampling process as a series of impulses (spikes) spaced at intervals matching the sampling rate.
Purpose:
- Visualization: Helps illustrate how continuous signals are converted into discrete samples and how aliasing occurs.
Mechanism:
- Sampling Representation: Multiplying the analog signal by the impulse train shows the sampled version of the signal.
- Frequency Domain: Creates a periodic repetition of the signal’s spectrum, revealing how frequencies above the Nyquist Frequency are aliased.
Example:
- For a 3 kHz signal sampled at 8 kHz, the impulse train demonstrates how frequencies above 4 kHz are folded into the 0 to 4 kHz range.

Conclusion

In summary, Analog-to-Digital Conversion (ADC) is vital for accurately representing analog signals in digital form. It involves understanding quantization errors, sampling rates, and aliasing to ensure signal integrity. Just as ADC translates analog signals to digital, Digital-to-Analog Conversion (DAC) performs the reverse process, converting digital data back to analog signals. Both ADC and DAC face similar challenges, such as quantization errors, and their interplay is crucial for effective signal processing. In the next blog, we’ll explore DAC in detail, highlighting how it complements ADC in converting between analog and digital domains.
